Financial Highlights
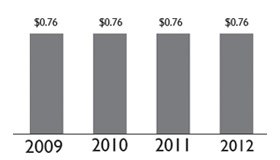
Distributions Paid (per share)
as of December 31
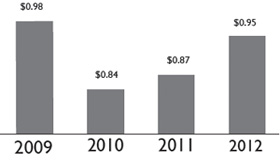
Funds from Operations (FFO)* (per share)
as of December 31
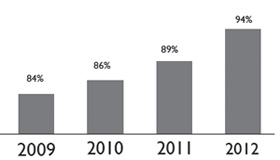
Leased Percentage
Balance Sheet Data - Year Ended December 31
| (In thousands, except per share amounts) |
2009 |
2010 |
2011 |
2012 |
| Data Consolidated for Mobile Viewing *FFO is a non-GAAP financial measure currently used in the real estate industry that we believe provides useful information to investors. Please refer to page A-1 of this Annual Report for a definition of FFO and a reconciliation of net income to FFO. |
| Total assets |
$1,154,850 |
$1,238,735 |
$1,408,661 |
$1,527,179 |
| Total liabilities |
$217,576 |
$317,177 |
$487,294 |
$662,430 |
| Total shareholders’ equity |
$937,274 |
$921,558 |
$921,367 |
$864,749 |
| Shares outstanding at year-end |
$79,681 |
$81,437 |
$82,937 |
$82,937 |
| Shareholders’ equity per share |
$11.76 |
$11.32 |
$11.11 |
$10.42 |
| Dividends paid for the year ended December 31 |
$55,313 |
$60,586 |
$62,177 |
$63,032 |
Return To Top ↑

